

403
likes
3
comments
daily view 0
monthly view 0
Live Analytics
Comments 0
VExUS Made Easy: 4 Simple Steps to Assess Venous Congestion Analytics Table
Income Estimates for VExUS Made Easy: 4 Simple Steps to Assess Venous Congestion
Based on this YouTube video's total view count of 21.8K views and industry-standard rates, the estimated total earning is $15 - $44 through ad revenue. Historical data is not yet available to calculate daily, weekly, or monthly averages.
About VExUS Made Easy: 4 Simple Steps to Assess Venous Congestion
Explore VExUS Made Easy: 4 Simple Steps to Assess Venous Congestion with 21,864 views, 403 likes, and 3 comments. Experience the impact of this video content that has captured audience attention.
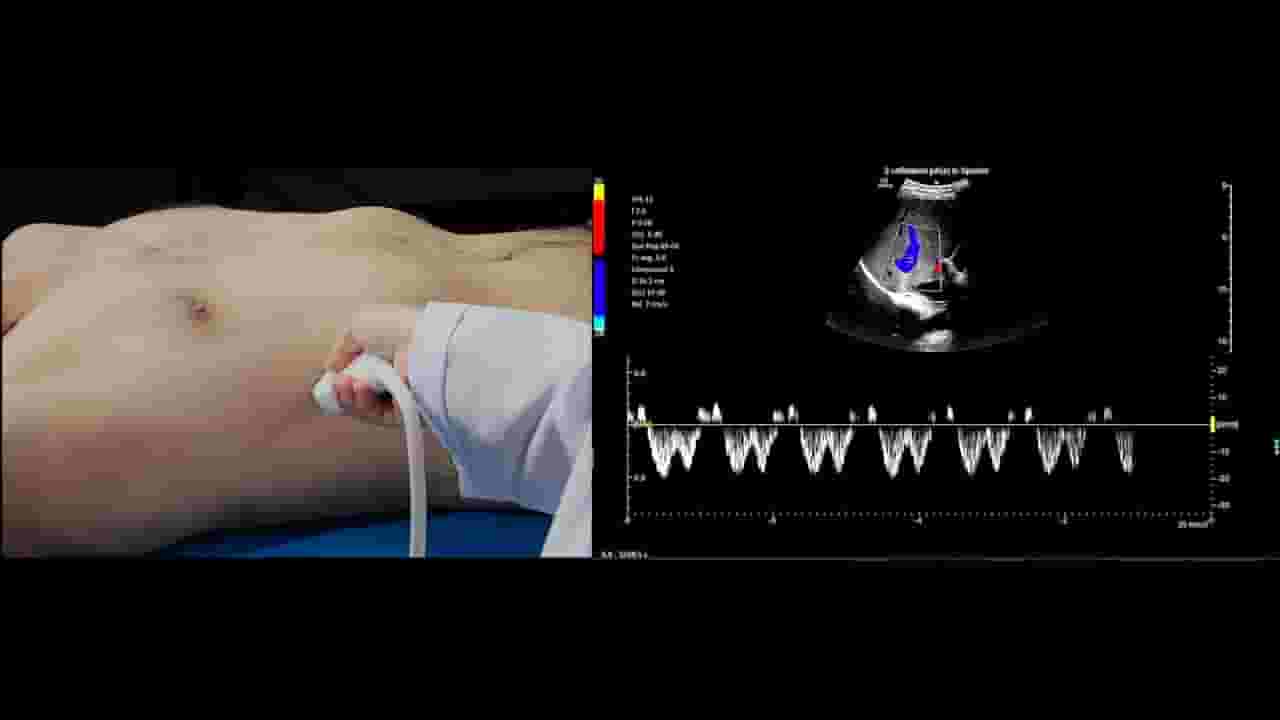
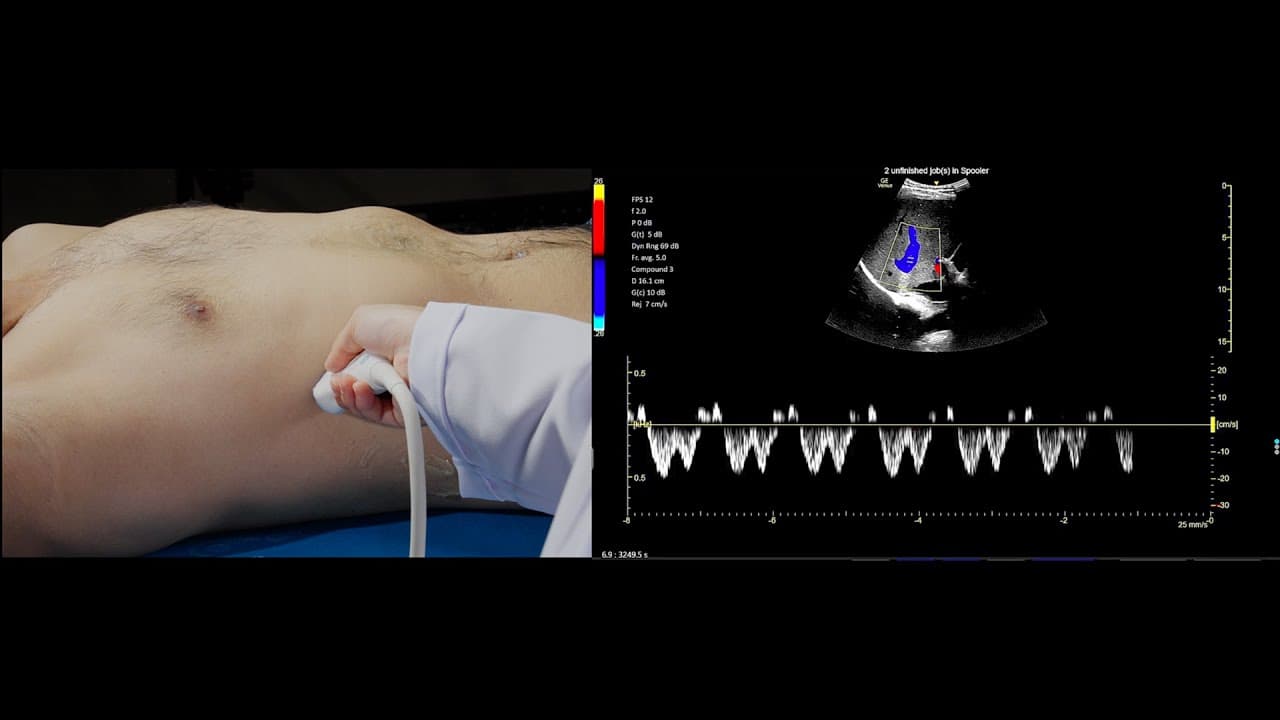
VExUS Simplified: A Step-by-Step Guide to Assessing Venous Congestion 1. Start with the IVC (Inferior Vena Cava): Use a subxiphoid view in short axis via liver window Measure IVC 1–2 cm below the RA–IVC or HV–IVC junction Long-axis shows IVC connecting to RA and hepatic vein IVC 2 cm or less = VExUS Grade 0 (Asian patients may need a lower cutoff) Use B-mode or M-mode to check collapsibility 2. Assess the Hepatic Vein (HV): Use subxiphoid or coronal view Place Doppler gate 1–2 cm into the HV, away from junction Ask patient to hold breath at end-expiration Doppler waveforms: A-wave (retrograde) = atrial contraction (P wave) S-wave (antegrade) = systole (QRS) V-wave (retrograde) = end-systole D-wave (antegrade) = diastole (after T wave) Normally S is greater than D. In congestion, S weakens or reverses 3. Evaluate Portal Vein (PV): Use coronal view near the right kidney Color Doppler shows continuous red flow toward the probe Pulsatility Index (PVPF = max minus min, divided by max): Under 30 percent = Normal 30 to 50 percent = Mild congestion Over 50 percent = Severe Flow reversal = Very severe congestion 4. Check Intrarenal Veins (IRV): Scan in coronal view over the kidney Use color Doppler: red = arterial, blue = venous Place PW Doppler on interlobar or arcuate veins Normal = smooth, continuous flow with little pulsatility Congestion = interrupted, pulsatile flow with distinct S and D waves Use arterial waveform to match with cardiac phases #VExUS #POCUS #Ultrasound #Shock #CriticalCare #emergencymedicine #resusultrasound
About YouTube Real-Time View Count
With SocialCounts.org’s view counter, track your YouTube video’s live view count and YouTube likes count in real time with fast, reliable updates.
Watch every YouTube video live view count rise with our real-time YouTube views tracker—built for accuracy and minimal delay.
Follow YouTube real time views as they happen, using our dedicated view counter for YouTube videos.
Get up-to-date live view count on YouTube and see real-time growth with SocialCounts.org’s smart tracking tools.
Embed Widget
Parameters:
fullscreen=true- Fullscreen countergraph=true- Live graph chartcounter=0/1/2- Select counter (0=likes, 1=views, 2=comments)
URL
Click to copy the embed URL to your clipboard