


Live Analytics
Comments 0
t-tests and p values Analytics Table
Income Estimates for t-tests and p values
Based on this YouTube video's total view count of 165K views and industry-standard rates, the estimated total earning is $116 - $332 through ad revenue. Historical data is not yet available to calculate daily, weekly, or monthly averages.
About t-tests and p values
Explore t-tests and p values with 165,772 views, 4,295 likes, and 132 comments. Experience the impact of this video content that has captured audience attention.
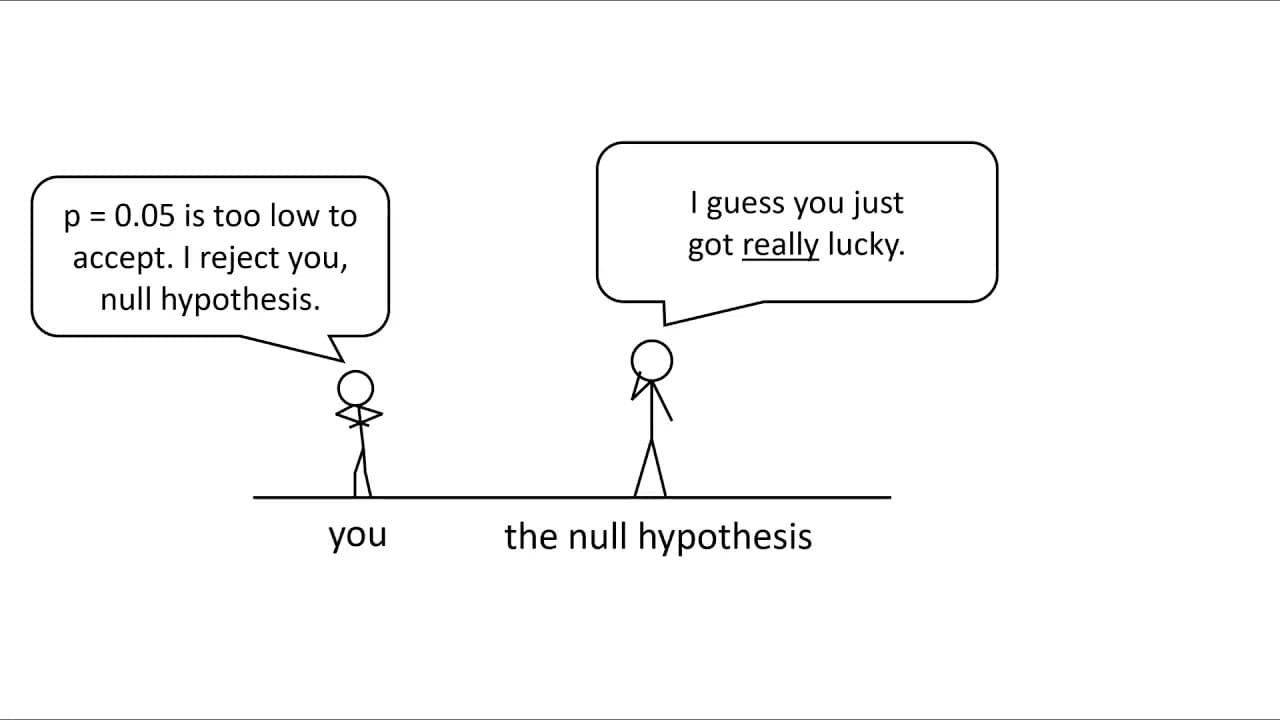
Note: this video omits one part of the p-value definition, which needs to be covered next after watching this video. The p-value is the probability that the null hypothesis assigns to your observed difference *or more extreme differences*. For example, we can imagine the average height is known to be 1.7 meters in a give country. You wonder if a subpopulation in a specific geography is taller. So, you use a null hypothesis H0: average height = 1.7 meters. You draw a random sample and measure a sample average of x = 1.9 meters. You calculate a p-value of p = 0.04, which means there's a 4% chance according to the null hypothesis of measuring a difference of 0.2 meters *or greater*. Symbolically, we represent this as P(X ≥ x | H0) where X is the sample statistic you are measuring (average height), x is the instantiation or actual value you've acquired in some particular sample, and "|" means "given" and H0 is the null hypothesis. All together, the last part means "given that we're assuming the null hypothesis to be true." Intro: what is a p-value? It's not the probability that the alternative hypothesis is true. It's also not the probability that the null hypothesis is true. The p-value is how likely the null hypothesis thinks your DATA (or more extreme data) are. If the p-value is less than 0.05, then the only way the null hypothesis can explain your dataset is by calling it an incredibly rare statistical fluctuation. In those circumstances, we decide that the null hypothesis is a bad assumption, and we reject the null hypothesis. Instead, we conclude that something else (a true difference in the population at large) must explain the observed difference in the sample. After watching this video, there are some other things to study next: - The hypothesized null value is not always 0, as the example above shows. - The t-test can be one-sided (where you only consider more extreme differences on the same side of the distribution as your observed difference) or two-sided (where you consider more extreme differences on both sides of the distribution as your observed difference) - [For statistics MS students:] you will learn that it's possible to have simple a null hypothesis based on a single value from the parameter space (such as H0: µ = 1.7 meters) or a composite null hypothesis (such as H0: µ ≤ 1.7 meters).
About YouTube Real-Time View Count
With SocialCounts.org’s view counter, track your YouTube video’s live view count and YouTube likes count in real time with fast, reliable updates.
Watch every YouTube video live view count rise with our real-time YouTube views tracker—built for accuracy and minimal delay.
Follow YouTube real time views as they happen, using our dedicated view counter for YouTube videos.
Get up-to-date live view count on YouTube and see real-time growth with SocialCounts.org’s smart tracking tools.
Embed Widget
Parameters:
fullscreen=true- Fullscreen countergraph=true- Live graph chartcounter=0/1/2- Select counter (0=likes, 1=views, 2=comments)
URL
Click to copy the embed URL to your clipboard