


10
likes
1
comments
daily view 0
monthly view 0
Live Analytics
Comments 0
😎How to Trade for Beginners | 2 Trades, 2 Wins & +$500 Profit Analytics Table
Income Estimates for 😎How to Trade for Beginners | 2 Trades, 2 Wins & +$500 Profit
Based on this YouTube video's total view count of 1.13K views and industry-standard rates, the estimated total earning is $1 - $2 through ad revenue. Historical data is not yet available to calculate daily, weekly, or monthly averages.
About 😎How to Trade for Beginners | 2 Trades, 2 Wins & +$500 Profit
Explore 😎How to Trade for Beginners | 2 Trades, 2 Wins & +$500 Profit with 1,138 views, 10 likes, and 1 comments. Experience the impact of this video content that has captured audience attention.
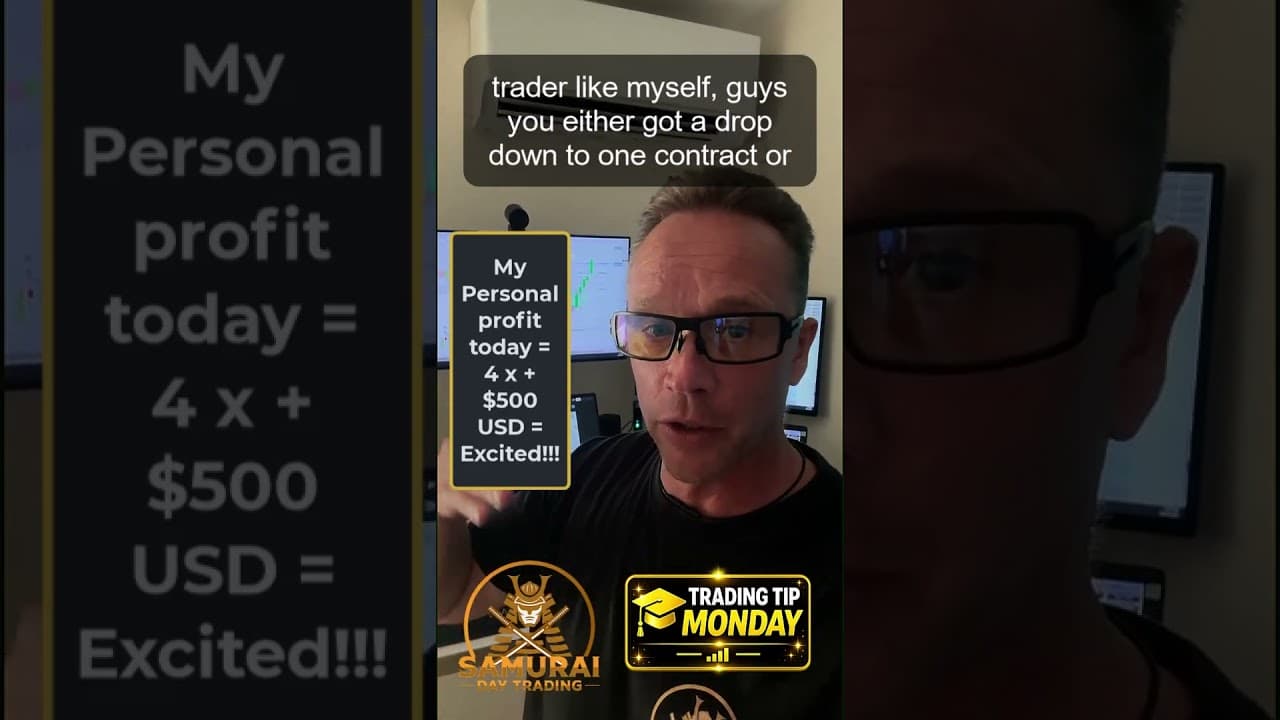
🔍Learn how to trade for beginners with 2 trades, 2 winning outcomes and more than $500 USD in profit from one Live Trading Room session. See how the Extreme Volume and DELTA Indicators helped identify high-probability opportunities across the S&P 500, NASDAQ and DAX 40 Futures markets. How to trade for beginners starts with learning how to recognise when powerful market evidence aligns. In today's Samurai Day Trading Live Trading Room, we identified: ✅ 2 Trades ✅ 2 Winning Outcomes ✅ More Than $500 USD Profit ✅ A 100% Winning Outcome Across the Two Trades Taken The standout performers in today's session were the Extreme Volume Indicator and the DELTA Indicator. These two tools provide very different—but highly complementary—forms of market intelligence. The Extreme Volume Indicator helps us identify exceptional levels of market participation and potential exhaustion. It can provide important evidence that buyers or sellers have committed significant volume to a move. The DELTA Indicator is designed to identify likely institutional order placement areas. It can operate as a trading signal in its own right, but it also becomes an exceptionally powerful confirmation tool when combined with an existing Samurai strategy or Candlestick Analysis setup. In today's session, the combination of: Extreme Volume + DELTA + Candlestick Analysis + Market Structure helped us identify two high-probability trading opportunities. The result was: 2 Trades. 2 Wins. More Than $500 USD Profit. But the real lesson for beginner traders is not simply the result. It is understanding the importance of waiting for evidence. Beginner traders often make the mistake of trying to trade every market move. Professional traders are far more selective. They wait for market structure, Candlestick Analysis and independent indicators to provide compelling evidence before committing to a trade. In this video, you'll learn more about: • How to trade for beginners • How to learn Futures Trading • How to trade the S&P 500 • How to trade the NASDAQ • How to trade the DAX 40 • How professional traders use market volume • How the DELTA Indicator identifies potential institutional activity • How multiple strategies can work together in synergy • Professional trade selection • Risk control and trade management • Patience, discipline and professional execution The Samurai methodology is built around a simple principle: Let the market tell you when to trade. When Candlestick Analysis identifies the opportunity, Extreme Volume provides market evidence and the DELTA Indicator confirms potential institutional participation, multiple independent pieces of information are pointing in the same direction. That is the type of trading evidence we want to see. 📈 Markets Traded S&P 500 Futures NASDAQ Futures DAX 40 Futures These are centrally traded Futures markets used by professional and institutional market participants around the world. 🌏 Futures Trading Education for the USA & Australia This video is designed for beginner and intermediate traders who want to learn: How to Trade for Beginners How to Start Trading How to Trade Futures How to Trade the S&P 500 How to Trade the NASDAQ How to Trade the DAX 40 Whether you are trading from the United States or Australia, the objective is the same: Wait for the evidence. Follow the strategy. Control the risk. 🥷 Discipline. Patience. Poise. Professional Trading. ⚠️ Important Customer Caution & Risk Notice This video is provided for educational purposes only and does not constitute financial, investment or trading advice. The two trades, two winning outcomes and profit figure shown relate to one specific trading session. They should not be interpreted as typical, guaranteed or expected future performance. A 100% winning outcome across two trades does not imply that every session, strategy or trader will achieve a 100% success rate. Futures Trading involves substantial risk and is not suitable for everyone. Losses can occur, individual results vary and past performance does not guarantee future results. Never trade with money you cannot afford to lose. Always understand the risks and use appropriate risk management before making any trading decision. #howtotrade #learntotrade #futurestrading #sp500 #nasdaq #internationaldaytradingacademy #daytrader @samuraidaytrading24
About YouTube Real-Time View Count
With SocialCounts.org’s view counter, track your YouTube video’s live view count and YouTube likes count in real time with fast, reliable updates.
Watch every YouTube video live view count rise with our real-time YouTube views tracker—built for accuracy and minimal delay.
Follow YouTube real time views as they happen, using our dedicated view counter for YouTube videos.
Get up-to-date live view count on YouTube and see real-time growth with SocialCounts.org’s smart tracking tools.
Embed Widget
Parameters:
fullscreen=true- Fullscreen countergraph=true- Live graph chartcounter=0/1/2- Select counter (0=likes, 1=views, 2=comments)
URL
Click to copy the embed URL to your clipboard