


2
likes
1
comments
daily view 0
monthly view 0
Live Analytics
Comments 0
132 Million Gallons: The Disaster That Didn't Have to Happen. #engineering Analytics Table
Income Estimates for 132 Million Gallons: The Disaster That Didn't Have to Happen. #engineering
Based on this YouTube video's total view count of 754 views and industry-standard rates, the estimated total earning is $1 - $2 through ad revenue. Historical data is not yet available to calculate daily, weekly, or monthly averages.
About 132 Million Gallons: The Disaster That Didn't Have to Happen. #engineering
Explore 132 Million Gallons: The Disaster That Didn't Have to Happen. #engineering with 754 views, 2 likes, and 1 comments. Experience the impact of this video content that has captured audience attention.
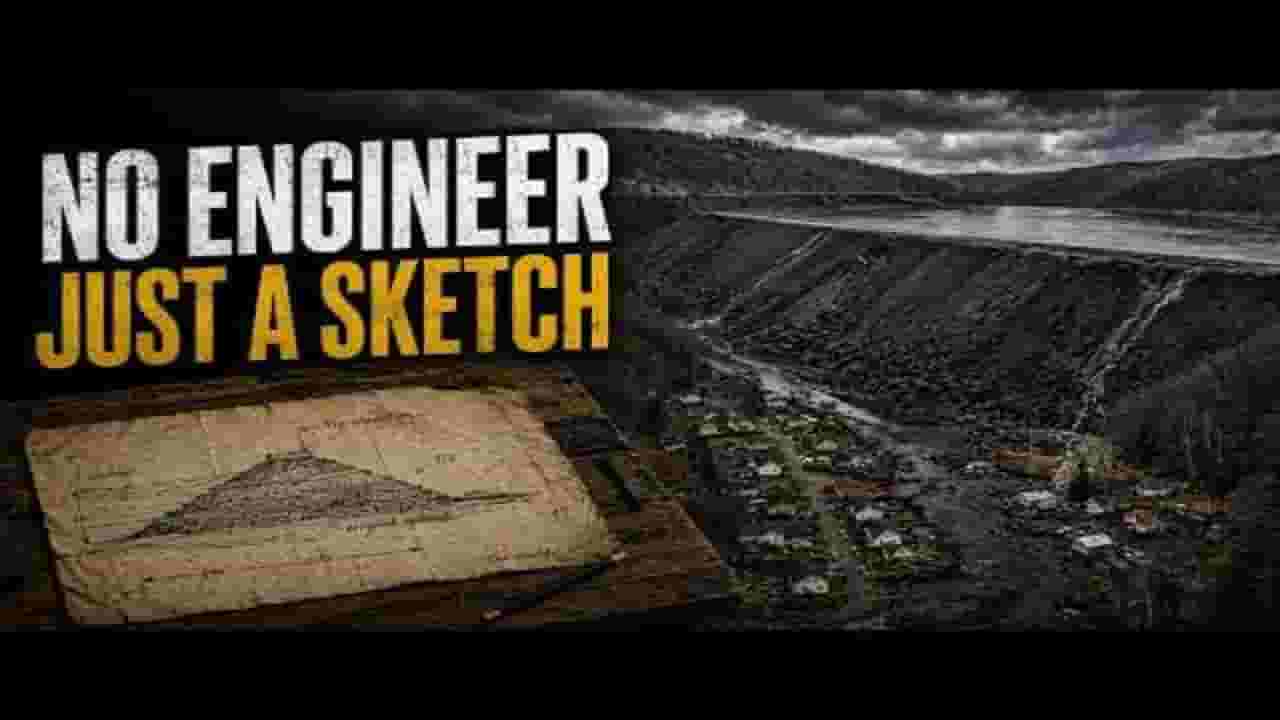
125 people died because a structure holding back 132 million gallons of water and coal waste was never properly engineered. On February 26, 1972, Buffalo Creek Dam Number 3 failed above a narrow valley in West Virginia. The flood that followed destroyed communities across roughly 17 miles of Buffalo Creek, killing 125 people, injuring more than 1,100, and leaving roughly 4,000 people homeless. But the most disturbing detail isn't how the structure failed. It's how it was built. There was no licensed engineer of record. No geotechnical survey. No documented slope-stability analysis. No calculated factor of safety. No proper compaction control. And no engineered spillway designed to safely handle extreme water levels. The construction record was essentially a hand-drawn sketch made by a coal company vice president with no engineering training. The structure was a coal-waste impoundment built using an upstream construction method. Mining waste was progressively dumped and pushed into place as water and coal refuse accumulated behind it. With proper engineering, monitoring, compaction and stability analysis, this type of construction can be used. At Buffalo Creek, those engineering controls were missing. Five years before the disaster, another Buffalo Creek impoundment had already partially failed. Then came days of heavy rain in February 1972. As water infiltrated the waste structure, internal pore-water pressure increased and the material's resistance to sliding decreased. On the morning of February 26, Dam Number 3 failed. The initial wave overwhelmed the two smaller impoundments below it, creating a cascading failure that sent an enormous wall of water and black coal waste through the valley. Communities had almost no time to react. The investigation that followed found that the impoundment had never been properly engineered to withstand the conditions that caused its failure. The disaster also exposed a regulatory gap: the structure had been inspected under mine-safety regulations, but there was no equivalent federal dam-safety framework requiring the engineering analysis that a conventional dam would have received. The company later faced intense criticism for describing the disaster as an “act of God.” Buffalo Creek became a major catalyst for changes in mine and dam safety regulation and became an enduring case study in geotechnical engineering, slope stability, seepage, piping, factor of safety, tailings dams and engineering ethics. But the deeper lesson is even more uncomfortable. This wasn't simply an engineering calculation that turned out to be wrong. The engineering was skipped entirely. And when engineering is replaced by assumptions, sketches and regulatory loopholes, there may be no safety margin left to discover until it is too late. This is the story of the Buffalo Creek Flood, one of America's most devastating industrial disasters — and the unengineered structure that failed above thousands of people. Chapters 00:00 — The Dam That Was Never Designed 00:55 — What Was Actually Built? 01:30 — The Upstream Construction Method 03:35 — The Warning Nobody Acted On 04:00 — The 1967 Failure 05:00 — Days of Heavy Rain 06:30 — The Collapse 07:00 — 132 Million Gallons 09:35 — The “Act of God” Defense 10:00 — The Investigation 11:30 — How Regulation Changed 12:10 — The Engineering Lesson 13:40 — What Happened Next Buffalo Creek wasn't a failure of a complicated engineering design. It was what happened when the engineering was never done. Subscribe for more engineering disasters, structural failures, hidden design problems, and the real decisions behind catastrophic failures. #Engineering #BuffaloCreek #GeotechnicalEngineering 🔎 TAGS Buffalo Creek Flood, Buffalo Creek disaster, Buffalo Creek Dam, Buffalo Creek Dam disaster, Buffalo Creek Flood 1972, Buffalo Creek West Virginia, Buffalo Creek flood explained, Buffalo Creek disaster explained, Buffalo Creek Dam collapse, Buffalo Creek coal disaster, Buffalo Creek coal waste, Buffalo Creek tailings dam, Buffalo Creek mining disaster, 1972 Buffalo Creek flood, 125 people Buffalo Creek, 132 million gallons, coal waste dam failure, coal waste impoundment, tailings dam failure, tailings dam disaster, mining dam failure, mining disasters, dam failure, dam collapse, dam disaster, unengineered dam, dam engineering, geotechnical engineering, geotechnical failure, geotechnical engineering disaster, slope stability, slope stability failure, factor of safety, factor of safety engineering, pore water pressure, phreatic surface, seepage, piping failure, earthen dam failure, upstream construction method, upstream dam construction, tailings engineering, mine safety, dam safety, structural engineering, civil engineering, engineering disasters, engineering failures, engineering documentary, engineering explained, catastrophic engineering, industrial disasters, American disasters, West Virginia disaster
About YouTube Real-Time View Count
With SocialCounts.org’s view counter, track your YouTube video’s live view count and YouTube likes count in real time with fast, reliable updates.
Watch every YouTube video live view count rise with our real-time YouTube views tracker—built for accuracy and minimal delay.
Follow YouTube real time views as they happen, using our dedicated view counter for YouTube videos.
Get up-to-date live view count on YouTube and see real-time growth with SocialCounts.org’s smart tracking tools.
Embed Widget
Parameters:
fullscreen=true- Fullscreen countergraph=true- Live graph chartcounter=0/1/2- Select counter (0=likes, 1=views, 2=comments)
URL
Click to copy the embed URL to your clipboard