

3,196
likes
451
comments
daily view 0
monthly view 0
Live Analytics
Comments 0
How to Make Bar Chart Race Video | Tutorial Analytics Table
Income Estimates for How to Make Bar Chart Race Video | Tutorial
Based on this YouTube video's total view count of 158K views and industry-standard rates, the estimated total earning is $111 - $316 through ad revenue. Historical data is not yet available to calculate daily, weekly, or monthly averages.
About How to Make Bar Chart Race Video | Tutorial
Explore How to Make Bar Chart Race Video | Tutorial with 158,087 views, 3,196 likes, and 451 comments. Experience the impact of this video content that has captured audience attention.
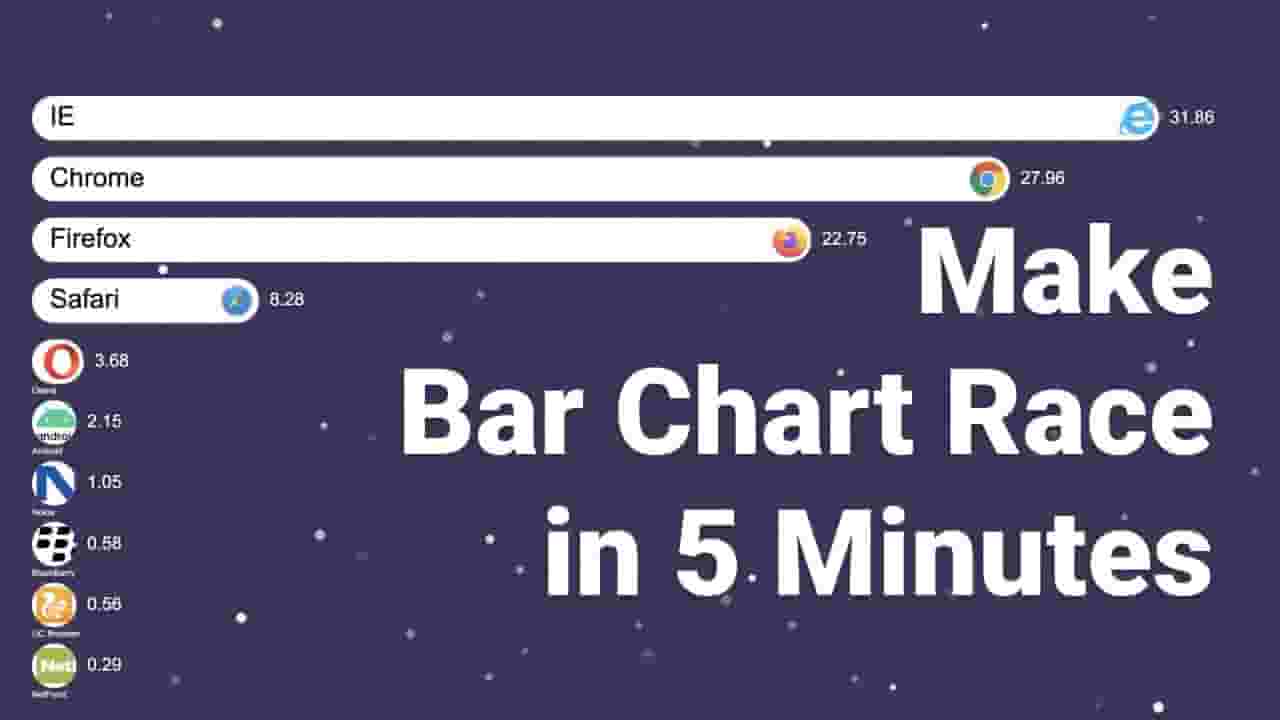
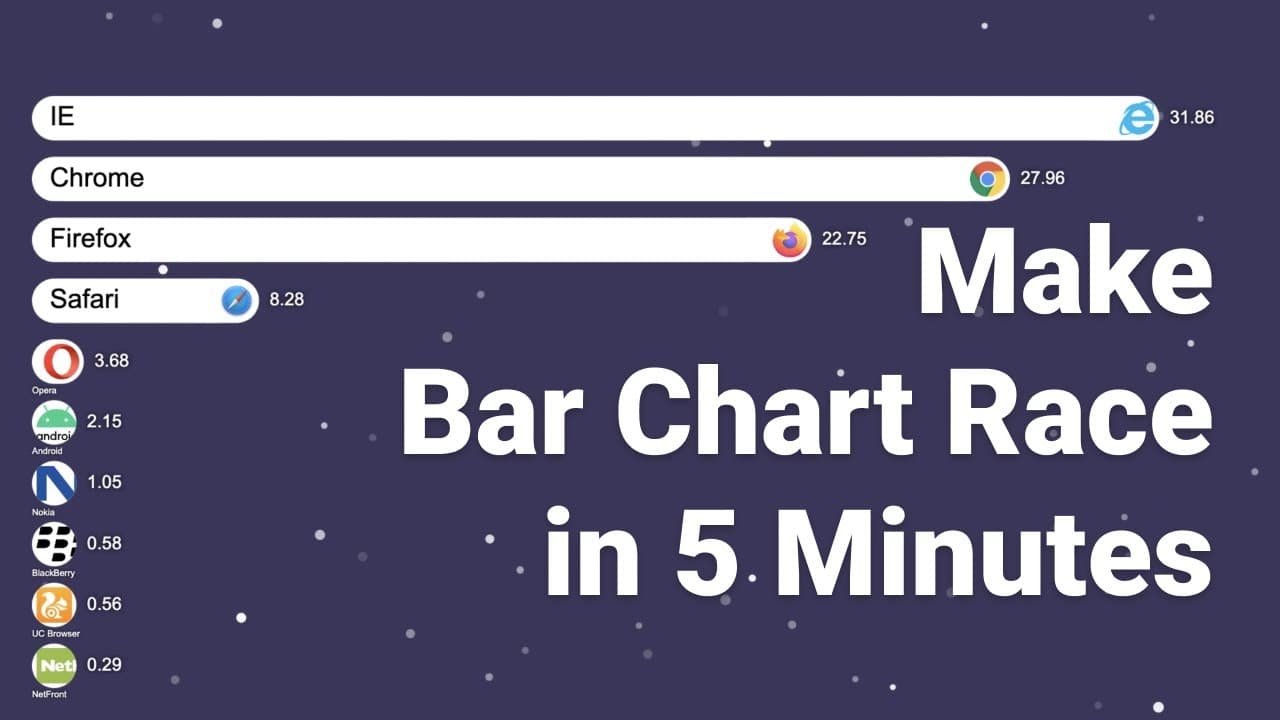
Make Bar Chart Race Videos via https://alienart.io Discord: https://discord.gg/DQUdFXd6Px Reddit: https://www.reddit.com/r/alienartcharts/ How to Make Bar Chart Race Video via Alien Art Charts without coding. Bar chart race video tutorial. How to make bar chart race tutorial. Bar chart race without coding. Data Source: https://gs.statcounter.com/ Music: Ambient Lounge - Wonderful Instrumental https://soundcloud.com/ashamaluevmusic/ambient-lounge?in=ashamaluevmusic/sets/no-copyright-music ____ Today I will show how to create your own bar chart race video for free and without coding using Alien Art Charts. Together will create a racing bar chart video of the top browsers over time. We will gather the data, customize the chart and get a video ready to be uploaded to YouTube. To get started, navigate to alienart.io and sign in via your favorite option. You can create a new project via the button in the top right corner. Now, let’s name the project, select “Bar Chart Race” as the type, choose “Landscape” orientation and finally click on the “Create” button. We have a working chart, but we need to find the data to fill it. Let’s open gs.statcounter.com in a separate tab. This website shows the data we need but only for the last year. Let’s click on “Edit Chart Data”, change the “From” value to “Jan 2009” and click on “View Chart”. Now we can click on the “Download Data” button, the output will be a file in CSV format. Now let’s get back to the chart we created. Clicking on the “Data” tab from the left will allow editing of the spreadsheet attached to the project. We can use the “Import” button to utilize the CSV file we just downloaded. Let’s go back to the preview tab and see the result. It seems like the bars are moving too fast. Changing the duration of the entire video will make them slower. To do that we can go to the “Layers” tab and click on the “Duration” toggle. This will allow inputting the length of the video. Let’s click on “Save” and preview again. As the next step, we can add browser icons. For that we can google the name of the first browser and then switch to the “Images” tab, find the image you like, then right-click on it and find an option to “Copy Image Address”. Now, let’s go back to Alien Art Charts and switch the tab to “Data”. Under every browser name, there is a “Choose” button which will open a panel on the right side, you can paste the image URL there and “Save” it. To customize the video we can use the “Layers” tab and, for example, select the “Background” layer. From the options of this layer, you can change the background color or set an image as the background. Finally, let’s go back to the “Preview” tab and click on the “Download” button in the right bottom corner of the screen. It will take a couple of minutes to create a video and it will be downloaded automatically. I hope you enjoyed the video. Don’t forget to subscribe for more tutorials.
About YouTube Real-Time View Count
With SocialCounts.org’s view counter, track your YouTube video’s live view count and YouTube likes count in real time with fast, reliable updates.
Watch every YouTube video live view count rise with our real-time YouTube views tracker—built for accuracy and minimal delay.
Follow YouTube real time views as they happen, using our dedicated view counter for YouTube videos.
Get up-to-date live view count on YouTube and see real-time growth with SocialCounts.org’s smart tracking tools.
Embed Widget
Parameters:
fullscreen=true- Fullscreen countergraph=true- Live graph chartcounter=0/1/2- Select counter (0=likes, 1=views, 2=comments)
URL
Click to copy the embed URL to your clipboard