

757
likes
87
comments
daily view 0
monthly view 0
Live Analytics
Comments 0
Runway Overrun During Rejected Takeoff in Bedford, MA 5/31/14. Analytics Table
Income Estimates for Runway Overrun During Rejected Takeoff in Bedford, MA 5/31/14.
Based on this YouTube video's total view count of 212K views and industry-standard rates, the estimated total earning is $149 - $425 through ad revenue. Historical data is not yet available to calculate daily, weekly, or monthly averages.
About Runway Overrun During Rejected Takeoff in Bedford, MA 5/31/14.
Explore Runway Overrun During Rejected Takeoff in Bedford, MA 5/31/14. with 212,432 views, 757 likes, and 87 comments. Experience the impact of this video content that has captured audience attention.
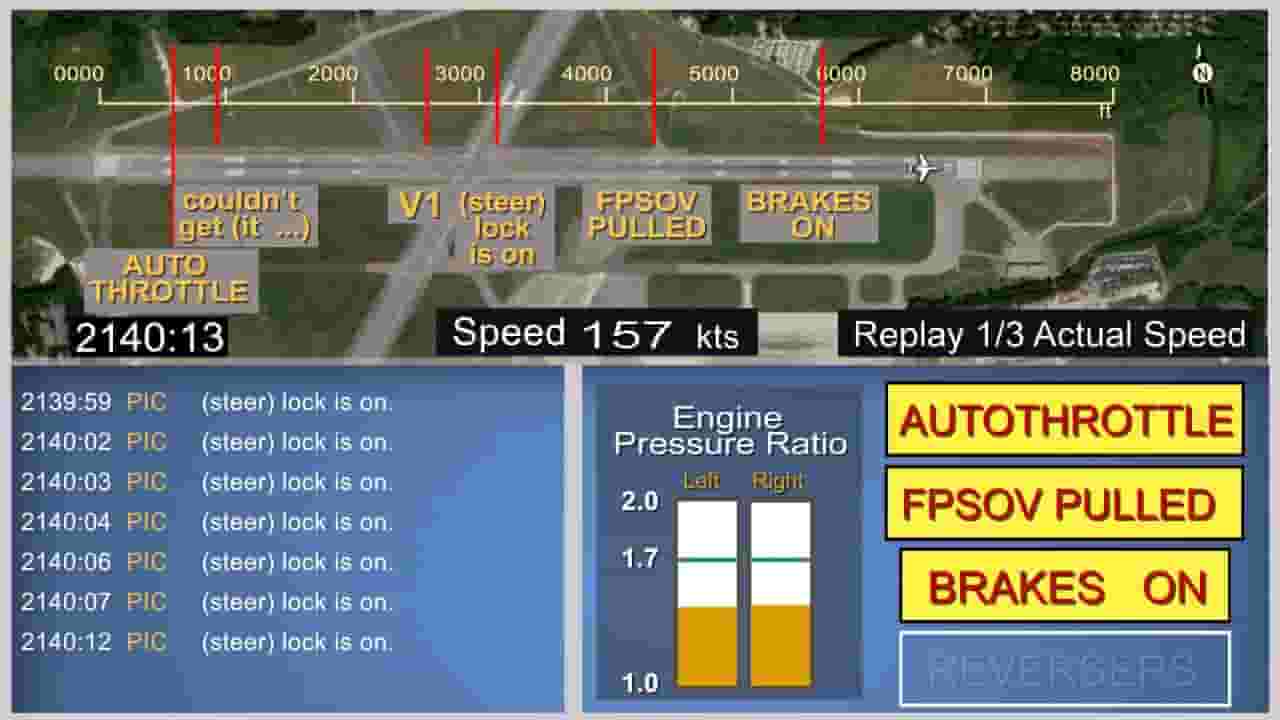
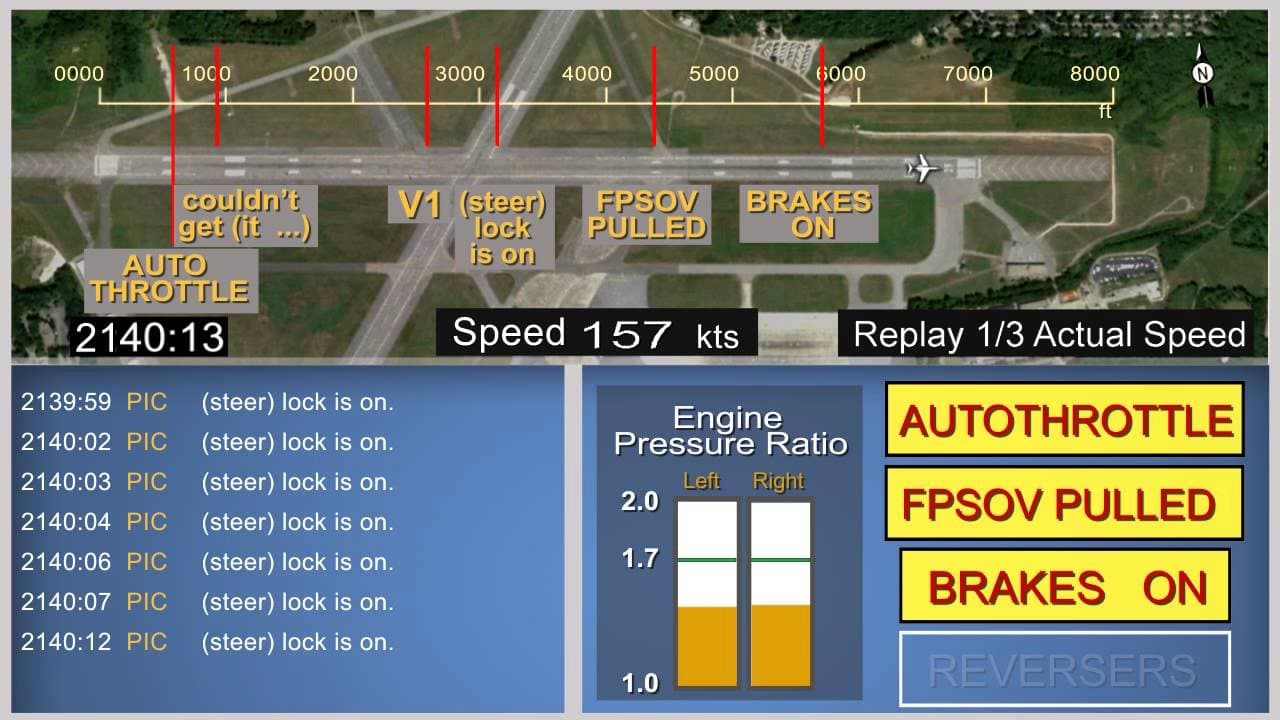
This two-dimensional animated reconstruction shows the sequence of events in the accident, which occurred on May 31, 2014, about 2140 Eastern Daylight Time, when a Gulfstream Aerospace Corporation G-IV (N121JM), owned by SK Travel, LLC and operated by Arizin Ventures, LLC, crashed after it overran the end of runway 11 during a rejected takeoff at Laurence G. Hanscom Field, Bedford, Massachusetts. The sequence of events were reconstructed based on information extracted from the airplane’s flight data recorder (FDR), the cockpit voice recorder (CVR) transcript, passive multilateration aircraft tracking data, ground scars, damage to airport structures, and aircraft performance data. For the purpose of visibility, the airplane is shown three times larger than actual size relative to the airport surroundings. The animation does not depict the weather or visibility conditions at the time of the accident. The animated sequence of events is first shown at one-third actual speed and is then shown again at actual speed. The animation includes audio narration. The animation begins as the airplane turns onto runway 11 at 2139:12 and ends at 2140:23 with the airplane coming to rest in a ravine formed by the Shawsheen River. The end of the animation transitions to two photographs. The first photograph shows the airport lighting, localizer antenna and airport perimeter fence that were struck by the airplane after it overran the runway. The second photograph shows the airplane at final rest in the ravine formed by the Shawsheen River. The airplane was destroyed by a post-crash fire. In the animation, the upper portion of the screen shows an overhead view of the airplane as it moves down runway 11, across the paved safety area and into the grass. A scale indicates the distance along the runway in feet from the threshold to the end of the pavement. During the animation, red vertical marks and associated text callouts are used to locate specific events. The middle of the screen shows Eastern Daylight Time, airplane speed in knots, and the replay speed of the animation. The lower left portion of the screen shows selected statements from the CVR transcript as text appearing at the time indicated in the transcript. The statements are attributed to either the Pilot-in-Command (PIC) or the Second-in-Command (SIC). The lower right portion of the screen depicts selected indicators, which display parameters that were either recorded on the FDR or were calculated using the recorded data. The Engine Pressure Ratio is displayed in the center of the screen; the target Engine Pressure Ratio of 1.7 typically used by the pilots is highlighted with a green horizontal bar. On the far right side of the screen, from top to bottom, indicators shown are for activation of the autothrottle, flight power shutoff valve (FPSOV), brakes and thrust reversers. Narration (one third speed) The animation does not depict the night lighting conditions that existed at the time of the accident. Certain system parameters or settings are shown, but these displays are not intended to mimic the actual displays in the cockpit. Selected comments from the CVR transcript attributed to the pilot-in-command (PIC) and second-in command (SIC) appear as text at the time indicated in the transcript, on left side of the display area. Based on a review of previous takeoff attempts, the flight crew likely targeted an Engine Pressure Ratio setting (or EPR) of 1.7, which is shown with a green horizontal bar. In addition, there are indications for activation of the Auto Throttle, Flight Power Shutoff Valve handle (or FPSOV), brakes, and thrust reversers Note: Animation is available upon request to Office Record Management Division (CIO-40)
About YouTube Real-Time View Count
With SocialCounts.org’s view counter, track your YouTube video’s live view count and YouTube likes count in real time with fast, reliable updates.
Watch every YouTube video live view count rise with our real-time YouTube views tracker—built for accuracy and minimal delay.
Follow YouTube real time views as they happen, using our dedicated view counter for YouTube videos.
Get up-to-date live view count on YouTube and see real-time growth with SocialCounts.org’s smart tracking tools.
Embed Widget
Parameters:
fullscreen=true- Fullscreen countergraph=true- Live graph chartcounter=0/1/2- Select counter (0=likes, 1=views, 2=comments)
URL
Click to copy the embed URL to your clipboard