

3,134
likes
300
comments
daily view 0
monthly view 0
Live Analytics
Comments 0
Use Excel to graph the efficient frontier of a three security portfolio Analytics Table
Income Estimates for Use Excel to graph the efficient frontier of a three security portfolio
Based on this YouTube video's total view count of 172K views and industry-standard rates, the estimated total earning is $121 - $345 through ad revenue. Historical data is not yet available to calculate daily, weekly, or monthly averages.
About Use Excel to graph the efficient frontier of a three security portfolio
Explore Use Excel to graph the efficient frontier of a three security portfolio with 172,727 views, 3,134 likes, and 300 comments. Experience the impact of this video content that has captured audience attention.
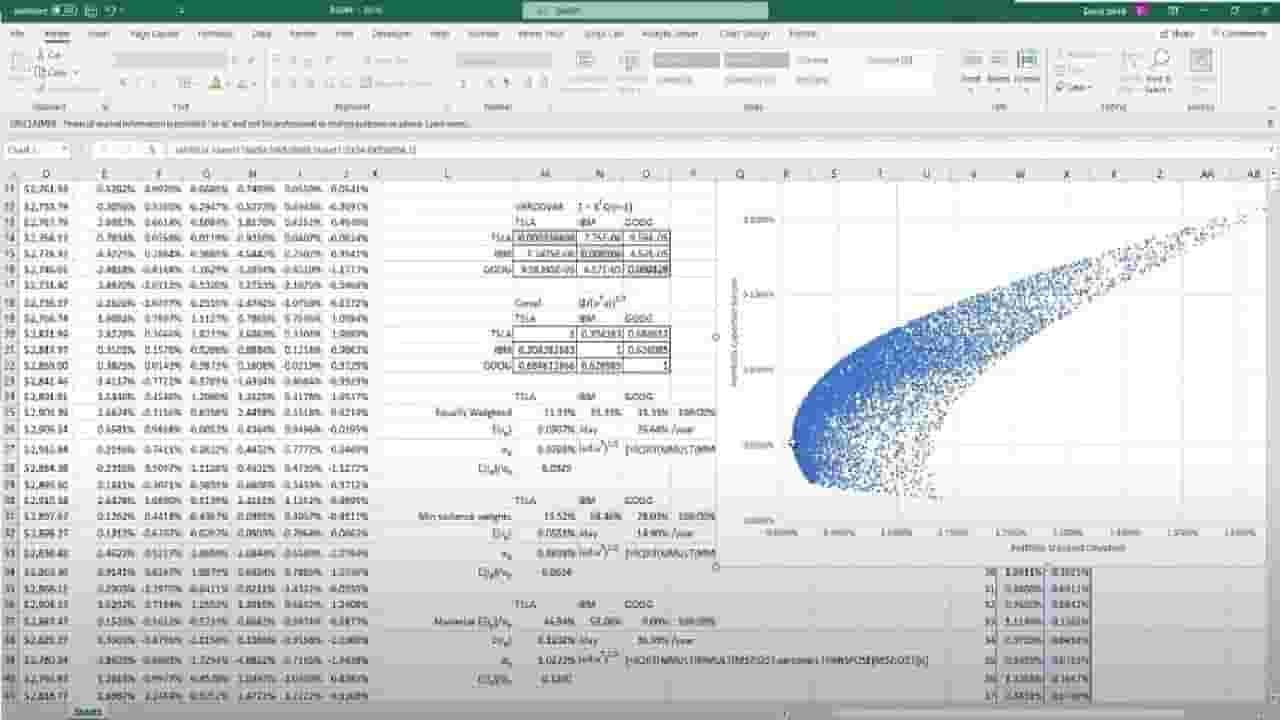
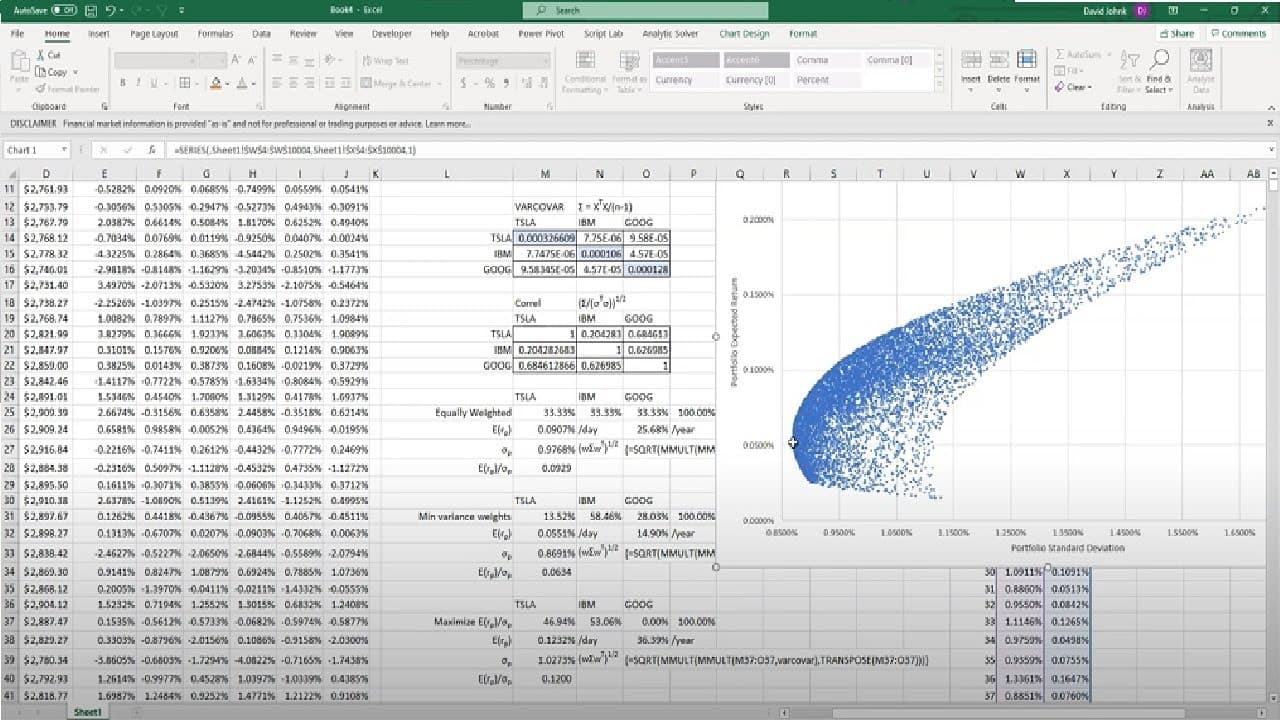
PLEASE NOTE - I MADE AN ERROR IN THE VIDEO: you don't have to take the square root when calculating the correlation matrix, that was an error on my part sorry! This error didn't effect the overall results because the correlation matrix was for informational purposes in this video. Download stock data, construct a variance-covariance matrix and use Excel Solver to optimize portfolios. Video demonstrates how to randomize investment weights in order to graph the efficient frontier of a three-stock portfolio. Here's the link to the file I used: https://bit.ly/2ZIjMsk Important Notes: After posting this video I found out that it doesn't automatically refresh when you press F9, usually only up to a few thousand rows. /* These Excel Lambda functions calculate various portfolio statistics from a list of prices (P) sorted in ascending order (from old to new), and portfolio weights (w) */ /* Please note: */ /* 1) Expected values are not guaranteed values, they are based off of historical data */ /* 2) Results will differ with frequency (daily, monthly, etc) and number of observations */ /* 3) David W. Johnk assumes no responsibility or liability for any errors or omissions. This is provided in a "as is" basis with no guarantees of completeness, accuracy, usefulness or timeliness */ /* see my YouTube video; https://youtu.be/7CIkj9NIS0s */ periodicreturns = LAMBDA(P,OFFSET(P,1,0,ROWS(P)-1)/OFFSET(P,0,0,ROWS(P)-1)-1); expectedrets = LAMBDA(P,BYCOL(periodicreturns(P),LAMBDA(array, AVERAGE(array)))); stdevrets = LAMBDA(P,BYCOL(periodicreturns(P),LAMBDA(array,stdev.p(array)))); varrets = LAMBDA(P,BYCOL(periodicreturns(P),LAMBDA(array,var.p(array)))); excessrets = LAMBDA(P,periodicreturns(P)-expectedrets(P)); varcovarmatrix = LAMBDA(P,MMULT(TRANSPOSE(excessrets(P)),excessrets(P))/(ROWS(P) - 1)); correlmatrix = LAMBDA(P,varcovarmatrix(P)/mmult(transpose(stdevrets(P)),stdevrets(P))); portexpectedret = LAMBDA(w,P,sumproduct(w,expectedrets(P))); portstddev = LAMBDA(w,P,SQRT(MMULT(MMULT(w,varcovarmatrix(P)),TRANSPOSE(w))));
About YouTube Real-Time View Count
With SocialCounts.org’s view counter, track your YouTube video’s live view count and YouTube likes count in real time with fast, reliable updates.
Watch every YouTube video live view count rise with our real-time YouTube views tracker—built for accuracy and minimal delay.
Follow YouTube real time views as they happen, using our dedicated view counter for YouTube videos.
Get up-to-date live view count on YouTube and see real-time growth with SocialCounts.org’s smart tracking tools.
Embed Widget
Parameters:
fullscreen=true- Fullscreen countergraph=true- Live graph chartcounter=0/1/2- Select counter (0=likes, 1=views, 2=comments)
URL
Click to copy the embed URL to your clipboard