

3,796
likes
252
comments
daily view 0
monthly view 0
Live Analytics
Comments 0
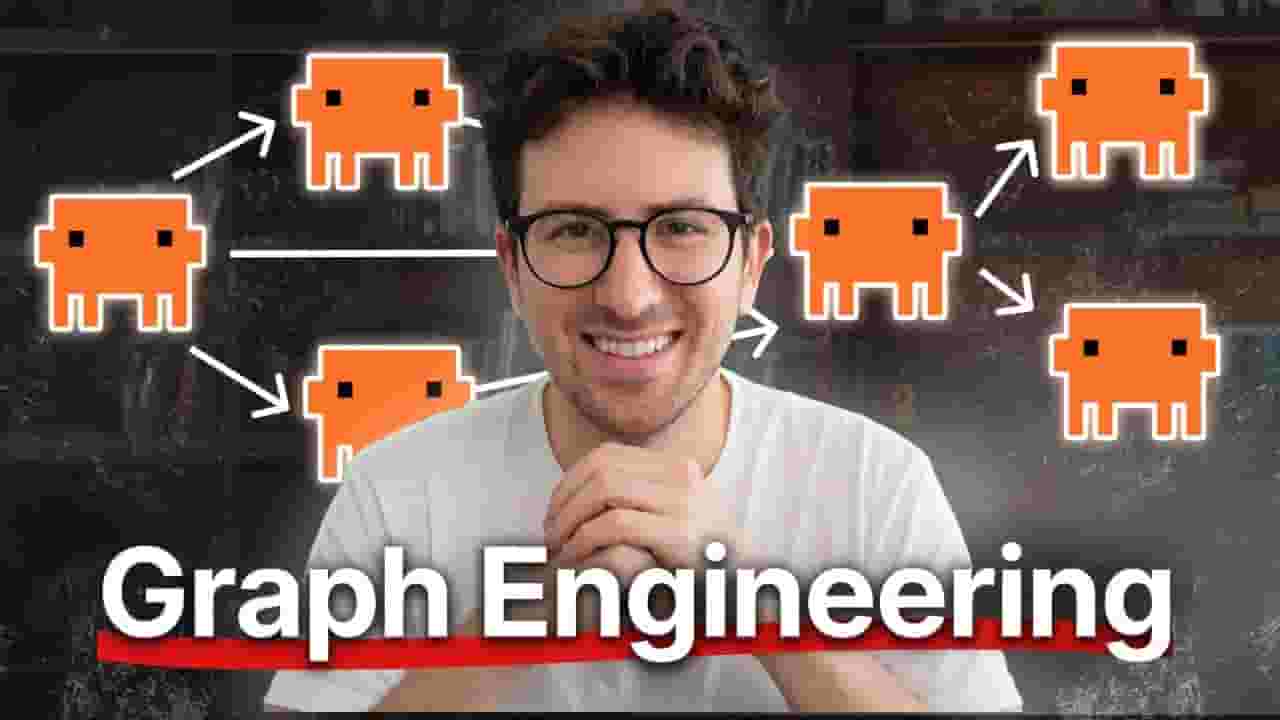
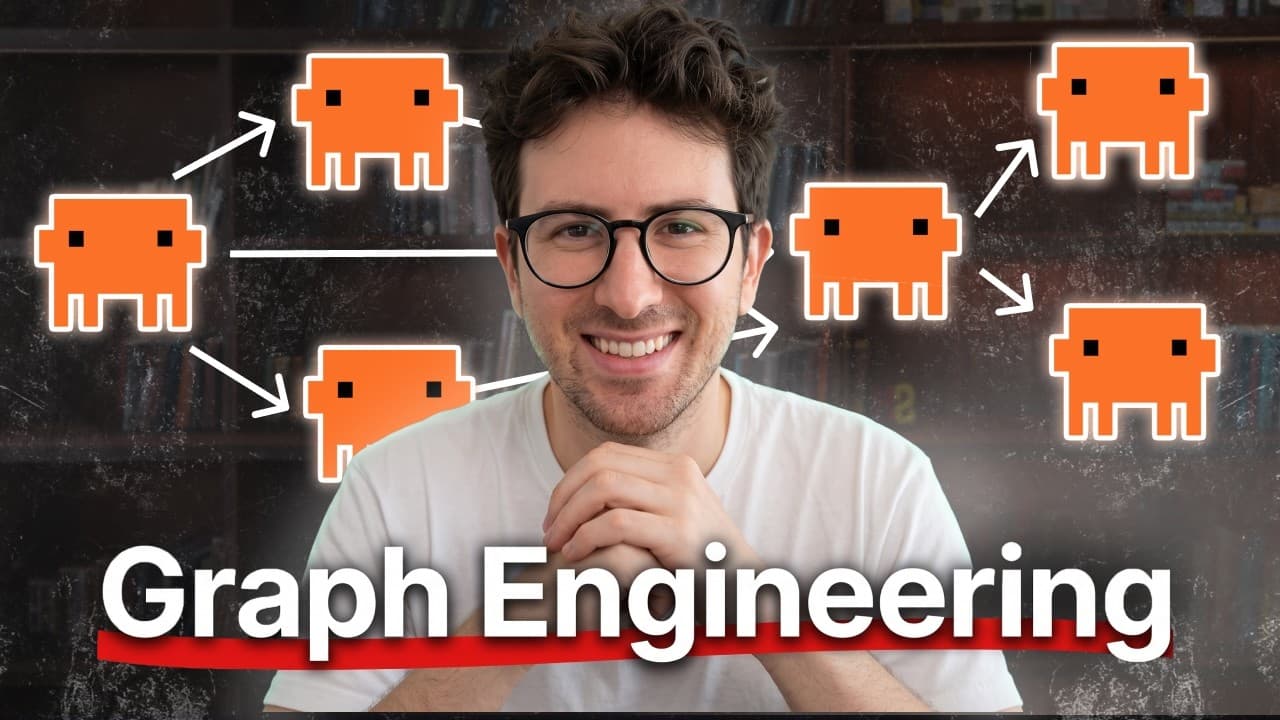
Why Graph Engineering will 10x your Claude/Codex Analytics Table
Income Estimates for Why Graph Engineering will 10x your Claude/Codex
Based on this YouTube video's total view count of 186K views and industry-standard rates, the estimated total earning is $130 - $372 through ad revenue. Historical data is not yet available to calculate daily, weekly, or monthly averages.
About Why Graph Engineering will 10x your Claude/Codex
Explore Why Graph Engineering will 10x your Claude/Codex with 186,096 views, 3,796 likes, and 252 comments. Experience the impact of this video content that has captured audience attention.
I go solo on this one to break down graph engineering, the term I keep seeing go viral on X. I define it in plain English: prompt engineering is how you ask AI a better question, context engineering is how you give AI better information, and graph engineering is how you design the work around the AI so it lives as a managed workflow instead of one giant chat. I walk through the vocabulary (jobs, arrows, state), separate knowledge graphs from agent graphs, and run a full worked example on whether to launch an AI bookkeeping product for Shopify merchants. Then I show three levels of implementation, from manual lanes on a whiteboard up to LangGraph and n8n, plus ready-made graphs for support, content, and code. You leave with a repeatable way to turn one AI workflow you already run into a map of steps, checks, handoffs, loops, and human approvals. Timestamps 00:00 – Intro 01:24 – Prompt Engineering, Context Engineering, Graph Engineering 02:50 – Chat vs Graph 03:35 – Defining Terms and Workflows 06:44 – Knowledge Graphs vs Agent Graphs 08:47 – When to use Graph Engineering 10:01 – Example: AI Bookkeeping For Shopify Merchants 13:22 – The Diamond Pattern Graph Visualized 15:10 – Three Levels of Implementation 17:14 – Customer Support Graph 18:45 – Content Creation Graph 19:30 – Coding Graph 20:42 – The Trap Of Oversized Graphs 22:22 – Building Your First Graph 24:53 – Closing Thoughts Key Points • Graph engineering means designing the work around the AI: jobs connected by arrows, with shared state moving between them. • Knowledge graphs help AI understand how information connects; agent graphs help AI understand how work should move. • Reserve a graph for work with multiple steps, multiple sources, parallel paths, checks, risks, or approvals. • Separate the writer from the checker, since a single model grading its own answer inflates confidence. • Draw and run the graph manually first; add LangGraph, n8n, or Make com once the structure proves itself. • Aim for the smallest graph that raises quality, and place the human gate where mistakes get expensive. Numbered Section Summaries 1. Why Graph Engineering Is Trending I open with my honest first reaction to the term and place it alongside prompt engineering, context engineering, agent engineering, and vibe coding. I land on graph engineering as one of the useful ones, because it changes how you think about getting work done with AI. 2. Jobs, Arrows, And State A graph is jobs connected by arrows, with state as the shared record of what the system knows so far. I use customer support and YouTube production to show that real work already runs this way, with some steps in sequence and others in parallel. 3. Knowledge Graphs Versus Agent Graphs Knowledge graphs let AI reason across relationships between customers, companies, products, and teams, which helps where standard RAG returns the nearest-looking paragraph. Agent graphs govern how work moves between planner, researchers, skeptic, synthesizer, and human. This episode focuses on agent graphs, since that is the version you can apply this week. 4. Three Levels Of Implementation Level one runs manually with separate lanes and a drawing on Excalidraw or tldraw. Level two uses Claude Code, Codex, or a repo where each step writes its own file, leaving a paper trail you can compare and reuse. Level three brings in LangGraph for state checkpoints and human-in-the-loop approvals, AutoGen GraphFlow for branches and loops, and n8n or Make.com where the graph touches Slack, email, Airtable, or a CRM. 5. Graphs For Support, Content, And Code A support graph classifies the issue, checks account context, searches docs and policy, drafts a reply, runs a checker for accuracy, tone, and risk, then routes refunds and angry customers to a human. A content graph moves from research to thesis, examples, hook, script, and a checker on specificity and pacing before branching into titles, thumbnails, and captions. A coding graph plans, edits, reviews the diff, runs tests, checks the UI, hunts edge cases, and ends at a human approving the pull request. The #1 tool to find startup ideas/trends - https://www.ideabrowser.com LCA helps Fortune 500s and fast-growing startups build their future - from Warner Music to Fortnite to Dropbox. We turn 'what if' into reality with AI, apps, and next-gen products https://latecheckout.agency/ The Vibe Marketer - Resources for people into vibe marketing/marketing with AI: https://www.thevibemarketer.com/ FIND ME ON SOCIAL X/Twitter: https://twitter.com/gregisenberg Instagram: https://instagram.com/gregisenberg/ LinkedIn: https://www.linkedin.com/in/gisenberg/
About YouTube Real-Time View Count
With SocialCounts.org’s view counter, track your YouTube video’s live view count and YouTube likes count in real time with fast, reliable updates.
Watch every YouTube video live view count rise with our real-time YouTube views tracker—built for accuracy and minimal delay.
Follow YouTube real time views as they happen, using our dedicated view counter for YouTube videos.
Get up-to-date live view count on YouTube and see real-time growth with SocialCounts.org’s smart tracking tools.
Embed Widget
Parameters:
fullscreen=true- Fullscreen countergraph=true- Live graph chartcounter=0/1/2- Select counter (0=likes, 1=views, 2=comments)
URL
Click to copy the embed URL to your clipboard