


10,026,077
likes
11,194
comments
daily view 353K
monthly view 10.6M
Live Analytics
Comments 0
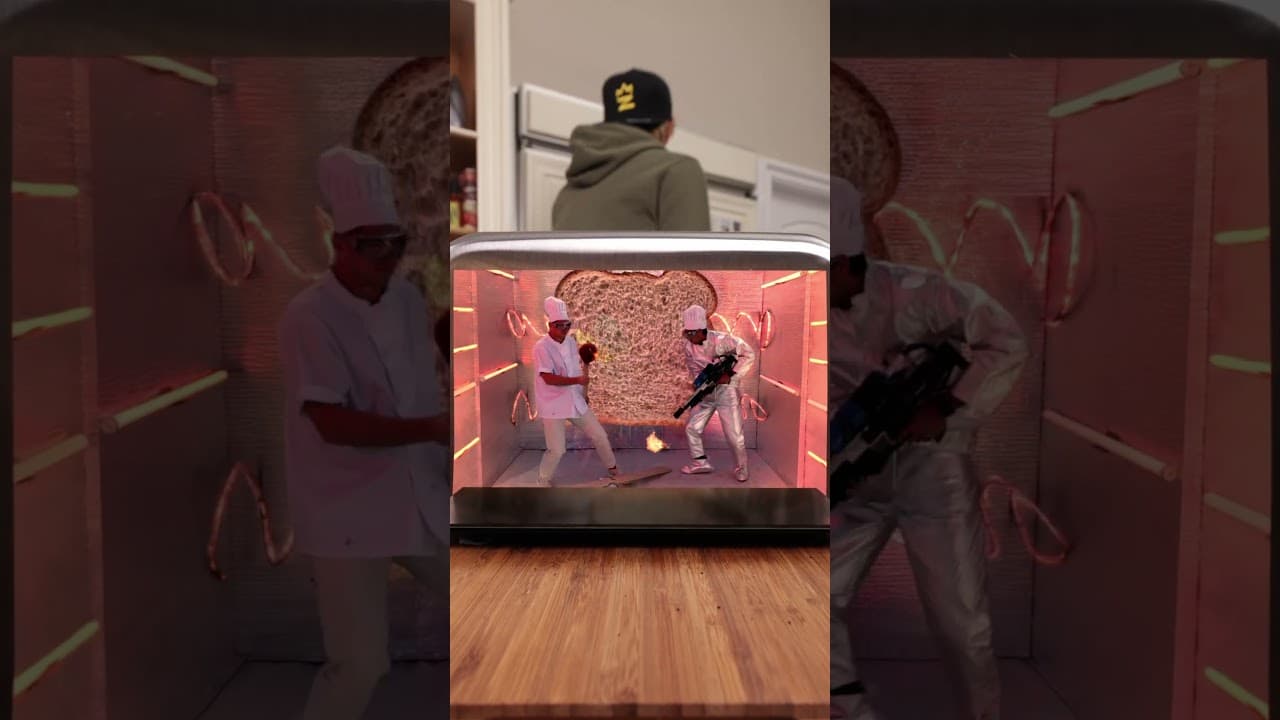
Analytics Table:Why is the TOAST always burnt?
| Date | views | likes | comments | Estimated Revenue |
|---|---|---|---|---|
Jul 17, 2026 Jul 17 Fri | 652M +180K | 10.0M +440 | 11.1K +1 | $126 - $360 |
Jul 16, 2026 Jul 16 Thu | 652M +506K | 10.0M +1.22K | 11.1K +3 | $355 - $1.01K |
Jul 15, 2026 Jul 15 Wed | 652M +495K | 10.0M +858 | 11.1K +4 | $347 - $991 |
Jul 14, 2026 Jul 14 Tue | 651M +750K | 10.0M +2.04K | 11.1K +9 | $525 - $1.50K |
Jul 13, 2026 Jul 13 Mon | 651M +793K | 10.0M +1.40K | 11.1K -1 | $555 - $1.58K |
Jul 12, 2026 Jul 12 Sun | 650M +1.17M | 10.0M +2.84K | 11.1K +4 | $820 - $2.34K |
Jul 11, 2026 Jul 11 Sat | 649M +1.59M | 10.0M +3.64K | 11.1K -1 | $1.11K - $3.18K |
Jul 10, 2026 Jul 10 Fri | 647M +1.31M | 10.0M +3.65K | 11.1K +3 | $917 - $2.62K |
Jul 9, 2026 Jul 9 Thu | 646M +390K | 10.0M +1.03K | 11.1K +2 | $273 - $780 |
Jul 8, 2026 Jul 8 Wed | 645M +207K | 10.0M +581 | 11.1K +2 | $146 - $416 |
Jul 7, 2026 Jul 7 Tue | 645M +87.4K | 10.0M +130 | 11.1K +2 | $61 - $175 |
Jul 6, 2026 Jul 6 Mon | 645M +27.4K | 10.0M -821 | 11.1K +1 | $19 - $55 |
Jul 5, 2026 Jul 5 Sun | 645M +18.7K | 10.0M -367 | 11.1K +3 | $13 - $37 |
Jul 4, 2026 Jul 4 Sat | 645M +14.0K | 10.0M +133 | 11.1K -2 | $10 - $28 |
Jul 3, 2026 Jul 3 Fri | 645M +12.5K | 10.0M +25 | 11.1K -10 | $9 - $25 |
Jul 2, 2026 Jul 2 Thu | 645M +21.1K | 10.0M -1.02K | 11.1K -- | $15 - $42 |
Jul 1, 2026 Jul 1 Wed | 645M +29.7K | 10.0M +97 | 11.1K -- | $21 - $60 |
Jun 30, 2026 Jun 30 Tue | 645M +32.9K | 10.0M -481 | 11.1K +3 | $23 - $66 |
Jun 29, 2026 Jun 29 Mon | 645M +49.7K | 10.0M -629 | 11.1K +1 | $35 - $100 |
Jun 28, 2026 Jun 28 Sun | 645M +121K | 10.0M +413 | 11.1K -2 | $85 - $244 |
Jun 27, 2026 Jun 27 Sat | 645M +187K | 10.0M +792 | 11.1K +8 | $131 - $374 |
Jun 26, 2026 Jun 26 Fri | 644M +92.5K | 10.0M +296 | 11.1K +1 | $65 - $185 |
Jun 25, 2026 Jun 25 Thu | 644M +195K | 10.0M +488 | 11.1K -- | $137 - $391 |
Jun 24, 2026 Jun 24 Wed | 644M +264K | 10.0M +107 | 11.1K -2 | $185 - $528 |
Jun 23, 2026 Jun 23 Tue | 644M +288K | 10.0M -136 | 11.1K -- | $202 - $578 |
Jun 22, 2026 Jun 22 Mon | 644M +474K | 10.0M +1.4K | 11.1K +3 | $332 - $948 |
Jun 21, 2026 Jun 21 Sun | 643M +453K | 10.0M +1.35K | 11.1K -2 | $318 - $907 |
Jun 20, 2026 Jun 20 Sat | 643M +270K | 10.0M +743 | 11.1K +4 | $190 - $542 |
Jun 19, 2026 Jun 19 Fri | 642M +213K | 10.0M +688 | 11.1K -3 | $149 - $427 |
Jun 18, 2026 Jun 18 Thu | 642M -- | 10.0M -- | 11.1K -- | $449K - $1.28M |
| Daily Average | +353K | +721 | +1 | $248 - $707 |
| Weekly Average | +2.47M | +5.05K | +7 | $1.73K - $4.95K |
| Last 29 Days | +10.2M | +20.9K | +31 | $7.18K - $20.5K |
Income Estimates for Why is the TOAST always burnt?
This YouTube video's view performance translates to estimated daily earnings of $248 - $707 based on standard rates. With consistent viewership, weekly income projections reach $1.73K - $4.95K, while monthly revenue estimates span $7.42K - $21.2K. The total estimated earnings from all 653M views amount to approximately $457K - $1.30M.
About Why is the TOAST always burnt?
Explore Why is the TOAST always burnt? with 653,066,011 views, 10,026,077 likes, and 11,194 comments. Experience the impact of this video content that has captured audience attention.
With Chef Nick DiGiovanni
About YouTube Real-Time View Count
With SocialCounts.org’s view counter, track your YouTube video’s live view count and YouTube likes count in real time with fast, reliable updates.
Watch every YouTube video live view count rise with our real-time YouTube views tracker—built for accuracy and minimal delay.
Follow YouTube real time views as they happen, using our dedicated view counter for YouTube videos.
Get up-to-date live view count on YouTube and see real-time growth with SocialCounts.org’s smart tracking tools.
Embed Widget
Parameters:
fullscreen=true- Fullscreen countergraph=true- Live graph chartcounter=0/1/2- Select counter (0=likes, 1=views, 2=comments)
URL
Click to copy the embed URL to your clipboard