

111
likes
3
comments
daily view 0
monthly view 0
Live Analytics
Comments 0
Market Crash Indicators: A Forensic Audit Analytics Table
Income Estimates for Market Crash Indicators: A Forensic Audit
Based on this YouTube video's total view count of 4.40K views and industry-standard rates, the estimated total earning is $3 - $9 through ad revenue. Historical data is not yet available to calculate daily, weekly, or monthly averages.
About Market Crash Indicators: A Forensic Audit
Explore Market Crash Indicators: A Forensic Audit with 4,400 views, 111 likes, and 3 comments. Experience the impact of this video content that has captured audience attention.
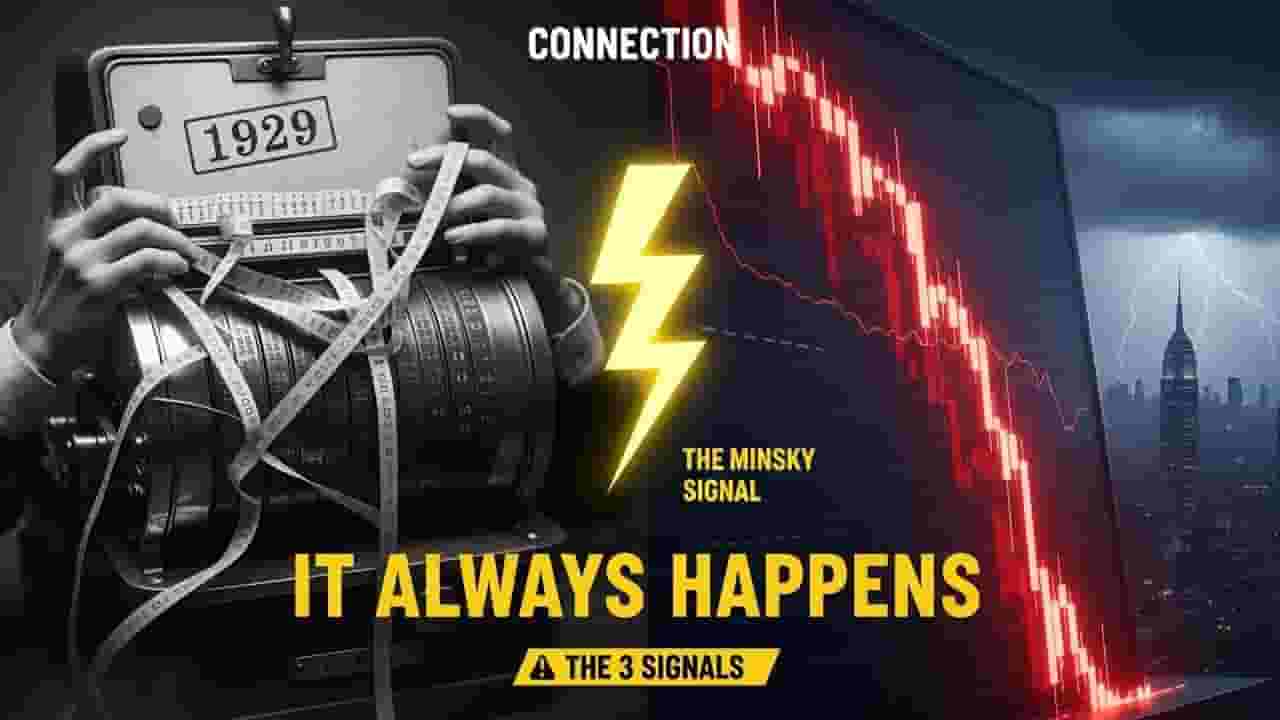
They tell you market crashes are unpredictable "Black Swan" events. They tell you no one could have seen it coming. They are lying. History proves that every major financial collapse—from the Tulip Mania of 1637 to the Great Crash of 1929 and the Housing Meltdown of 2008—followed the exact same script. The players change, the technology changes, but the three specific warning signs remain exactly the same. This full-length documentary is a forensic investigation into the Anatomy of a Crash. Drawing on the "Financial Instability Hypothesis" of economist Hyman Minsky, we decode the hidden signals that flash red right before the system breaks. We explain why stability is actually dangerous, how "Ponzi Finance" takes over the economy, and why the next crash is mathematically inevitable. The Core Analysis Includes: • The Minsky Moment: We break down the terrifying theory that "stability breeds instability." We explain the three stages of an economy—Hedge, Speculative, and Ponzi—and show how we have now entered the final, most dangerous phase where borrowers can't even pay the interest on their debt. • The Leverage Trap (Precursor 1): We analyze the data from 1929 and 2008 to show how "Margin Debt" explodes before a crash. We reveal how credit expansion creates a "pyramid scheme" structure that looks like growth until the liquidity dries up. • The Valuation Lie (Precursor 2): Every bubble needs a story. In 2000, it was the "New Economy." In 2008, it was "Real Estate Never Falls." We expose how extreme overvaluation is justified by experts claiming "this time is different" right before they lose everything. • The Policy Trap (Precursor 3): We reveal the role of the Federal Reserve and central banks. From the low rates of the 1920s to the Quantitative Easing of today, we show how "easy money" acts as the fuel for the fire, trapping policymakers in a cycle where they must print money to prevent collapse. • The Trigger Event: We examine Black Monday (1987) and the Lehman Brothers collapse to show that the trigger doesn't matter—the fragility does. We analyze the current global debt of $300 trillion and ask: what will be the catalyst this time? This is not just a history lesson. It is a roadmap for survival. The signs are flashing again. The debt is higher than ever. The speculation is rampant. The only question is: will you recognize the pattern before the music stops? #marketcrash #financialhistory #HymanMinsky #greatdepression #2008crisis #stockmarket #economiccollapse #recession #inflation ⚠️ Disclaimer: This documentary is based on comparative financial history and contemporary economic analysis of sovereign risk. The content explores fiscal mechanisms and global financial instability. It is not financial advice. Viewers are encouraged to conduct their own independent research. 🔔 Subscribe to The Financial Coin Historian for more deep-dive history and financial truth.
About YouTube Real-Time View Count
With SocialCounts.org’s view counter, track your YouTube video’s live view count and YouTube likes count in real time with fast, reliable updates.
Watch every YouTube video live view count rise with our real-time YouTube views tracker—built for accuracy and minimal delay.
Follow YouTube real time views as they happen, using our dedicated view counter for YouTube videos.
Get up-to-date live view count on YouTube and see real-time growth with SocialCounts.org’s smart tracking tools.
Embed Widget
Parameters:
fullscreen=true- Fullscreen countergraph=true- Live graph chartcounter=0/1/2- Select counter (0=likes, 1=views, 2=comments)
URL
Click to copy the embed URL to your clipboard