

Machine Learning Series 1: Exploratory Data Analysis (EDA) & Descriptive Statistics
2,199
Socialcounts.Org
101
likes
0
comments
daily view 0
monthly view 0
Live Analytics
Comments 0
Machine Learning Series 1: Exploratory Data Analysis (EDA) & Descriptive Statistics Analytics Table
Income Estimates for Machine Learning Series 1: Exploratory Data Analysis (EDA) & Descriptive Statistics
Based on this YouTube video's total view count of 2.2K views and industry-standard rates, the estimated total earning is $2 - $4 through ad revenue. Historical data is not yet available to calculate daily, weekly, or monthly averages.
About Machine Learning Series 1: Exploratory Data Analysis (EDA) & Descriptive Statistics
Explore Machine Learning Series 1: Exploratory Data Analysis (EDA) & Descriptive Statistics with 2,199 views, 101 likes, and 0 comments. Experience the impact of this video content that has captured audience attention.
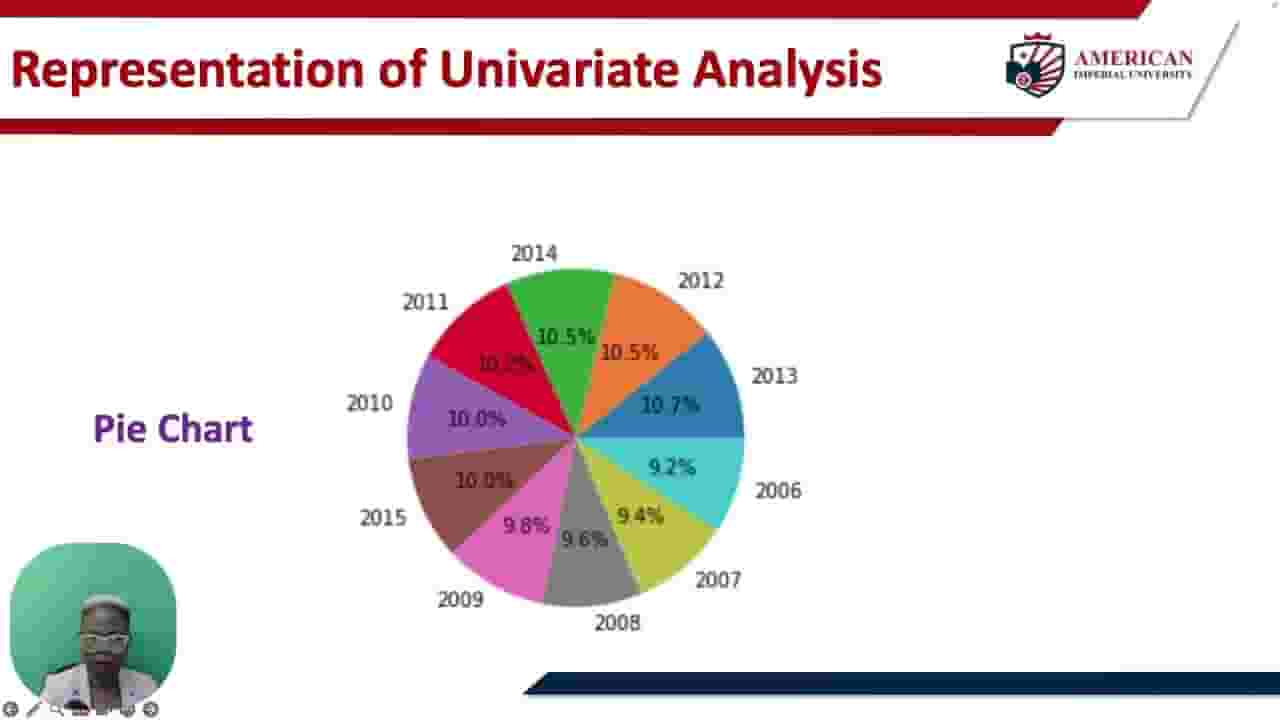
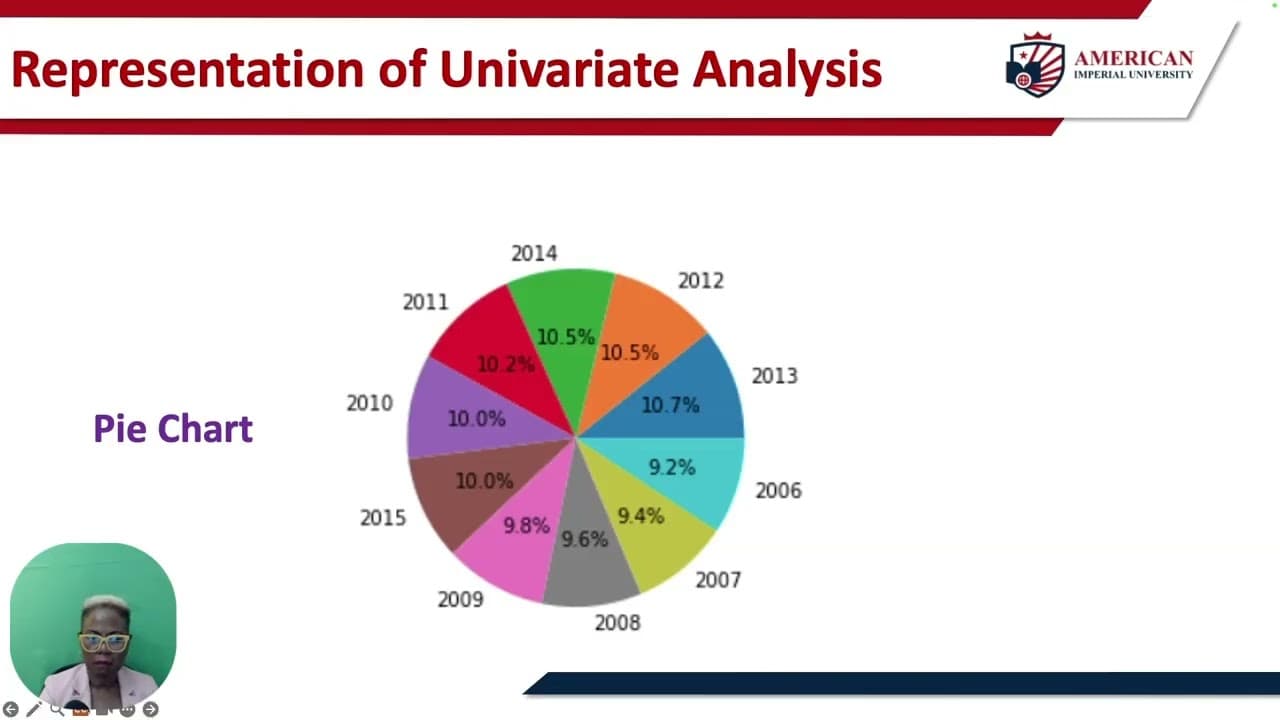
Build sound, reliable machine learning models by mastering the foundations of data profiling and exploratory data analysis (EDA). In this video, we break down how descriptive statistics, univariate exploration, and multivariate analysis uncover the essential personality, patterns, and relationships within your dataset. Whether you are preparing data for predictive modeling or cleaning features for machine learning pipelines, this tutorial walks you through practical visualization methods—from histograms and bar charts to correlation heatmaps and advanced multivariate techniques. 📌 What You’ll Learn: • Why descriptive statistics form the backbone of machine learning and data science • The difference between descriptive and inferential statistics in data exploration • Univariate Analysis: Evaluating shape, center, and spread using histograms, bar charts, and pie charts • Multivariate Analysis: Spotting complex feature interactions and behavioral patterns • How to read and interpret correlation heatmaps (positive vs. negative correlation) • Overview of key multivariate modeling techniques (Regression, PCA, Factor Analysis, ANOVA/MANOVA) ⏱️ Timestamps: 00:00 - Descriptive vs. Inferential Statistics in Machine Learning 01:11 - What is Exploratory Data Analysis (EDA)? 02:58 - Univariate Analysis: Understanding Single Features 04:11 - Visualizing Distributions (Histograms, Bar Charts & Pie Charts) 06:24 - Multivariate Analysis: Finding Relationships Between Features 08:06 - How to Read & Interpret Correlation Heatmaps 10:44 - Advanced Multivariate Methods (Regression, PCA, Factor Analysis, ANOVA) 🔔 Subscribe for in-depth data science tutorials, machine learning concepts, and statistics lessons. 🔗 Connect with Dr. Uohna 🌐 Website: https://druohna.com/ 💼 LinkedIn: https://www.linkedin.com/in/druohna-datascientist/ ✍️ Medium: https://medium.com/@druohnajune 📰 Substack: https://substack.com/@druohna 🎵 TikTok: https://www.tiktok.com/@datascience_n_dance ▶️ YouTube: https://www.youtube.com/@datasciencedoctor #ExploratoryDataAnalysis #DataScience #MachineLearning #Statistics #DataAnalytics #PythonDataScience #EDA #DataProfiling
About YouTube Real-Time View Count
With SocialCounts.org’s view counter, track your YouTube video’s live view count and YouTube likes count in real time with fast, reliable updates.
Watch every YouTube video live view count rise with our real-time YouTube views tracker—built for accuracy and minimal delay.
Follow YouTube real time views as they happen, using our dedicated view counter for YouTube videos.
Get up-to-date live view count on YouTube and see real-time growth with SocialCounts.org’s smart tracking tools.
Embed Widget
Parameters:
fullscreen=true- Fullscreen countergraph=true- Live graph chartcounter=0/1/2- Select counter (0=likes, 1=views, 2=comments)
URL
Click to copy the embed URL to your clipboard