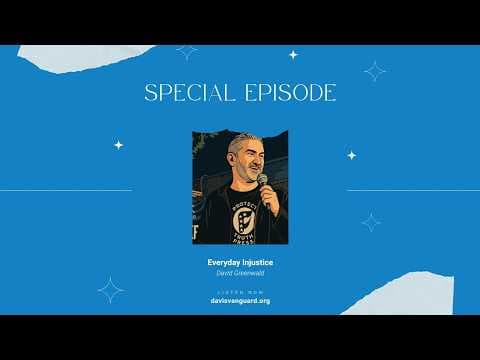
Everyday Injustice Special Edition: DA Candidate Chung Targets Corruption & Injustice in Santa Clara
Published May 18, 2026

At a glance
Views
5,661
Likes
8
Comments
0
Performance vs. channel
All-time outlier score
Engagement rate
More features coming
We're working on new analytics and tools. Stay tuned.
About
A special edition of the Everyday Injustice podcast brought together host David Greenwald, Ben Free Project founder Ben Frandsen, legal advocate Lydia Morgan, and Santa Clara County District Attorney candidate Daniel Chung for a sweeping discussion on wrongful convictions, prosecutorial misconduct, police accountabilit…
- Published
- May 18, 2026
- Made for kids
- No
More features coming
We're working on new analytics and tools. Stay tuned.
How Everyday Injustice Special Edition: DA Candidate Chung Targets Corruption & Injustice in Santa Clara is doing
It has 5.66K views in total. It ranks #15,173,375 among tracked YouTube videos by views.
Key facts about Everyday Injustice Special Edition: DA Candidate Chung Targets Corruption & Injustice in Santa Clara
- Total views
- 5.66K
- Total likes
- 8
- Total comments
- 0
- Published
- May 18, 2026
- Global rank by views
- #15,173,375
Frequently asked questions
How many views does Everyday Injustice Special Edition: DA Candidate Chung Targets Corruption & Injustice in Santa Clara have?
Everyday Injustice Special Edition: DA Candidate Chung Targets Corruption & Injustice in Santa Clara has 5,661 views, 8 likes, ranking #15,173,375 among tracked YouTube videos by views.
How accurate are these YouTube video analytics?
View, like, and comment counts come from YouTube's public API and refresh regularly. Growth and revenue figures are estimates built from tracked historical data, so they can differ slightly from what the creator sees privately in YouTube Studio.
What is the outlier score?
How this video's views compare to the channel's usual Shorts or long-form video. A 2x score means double the usual views for that channel, 0.5x means half.
What is engagement rate and how is it calculated?
Likes and comments per view, compared to this channel's typical engagement rate — shown as above or below what's usual for the channel.
How is the revenue estimate calculated?
It's a rough public estimate based on a $0.7–$2.0 CPM (revenue per 1,000 views) applied to view count — not actual creator earnings, which depend on ad rates, audience geography, and monetization settings YouTube doesn't expose publicly.
Is this YouTube video analytics checker free?
Yes. You get 10 free channel and video analytics lookups per 24 hours without an account — logging in, which is also free, removes that limit entirely.